

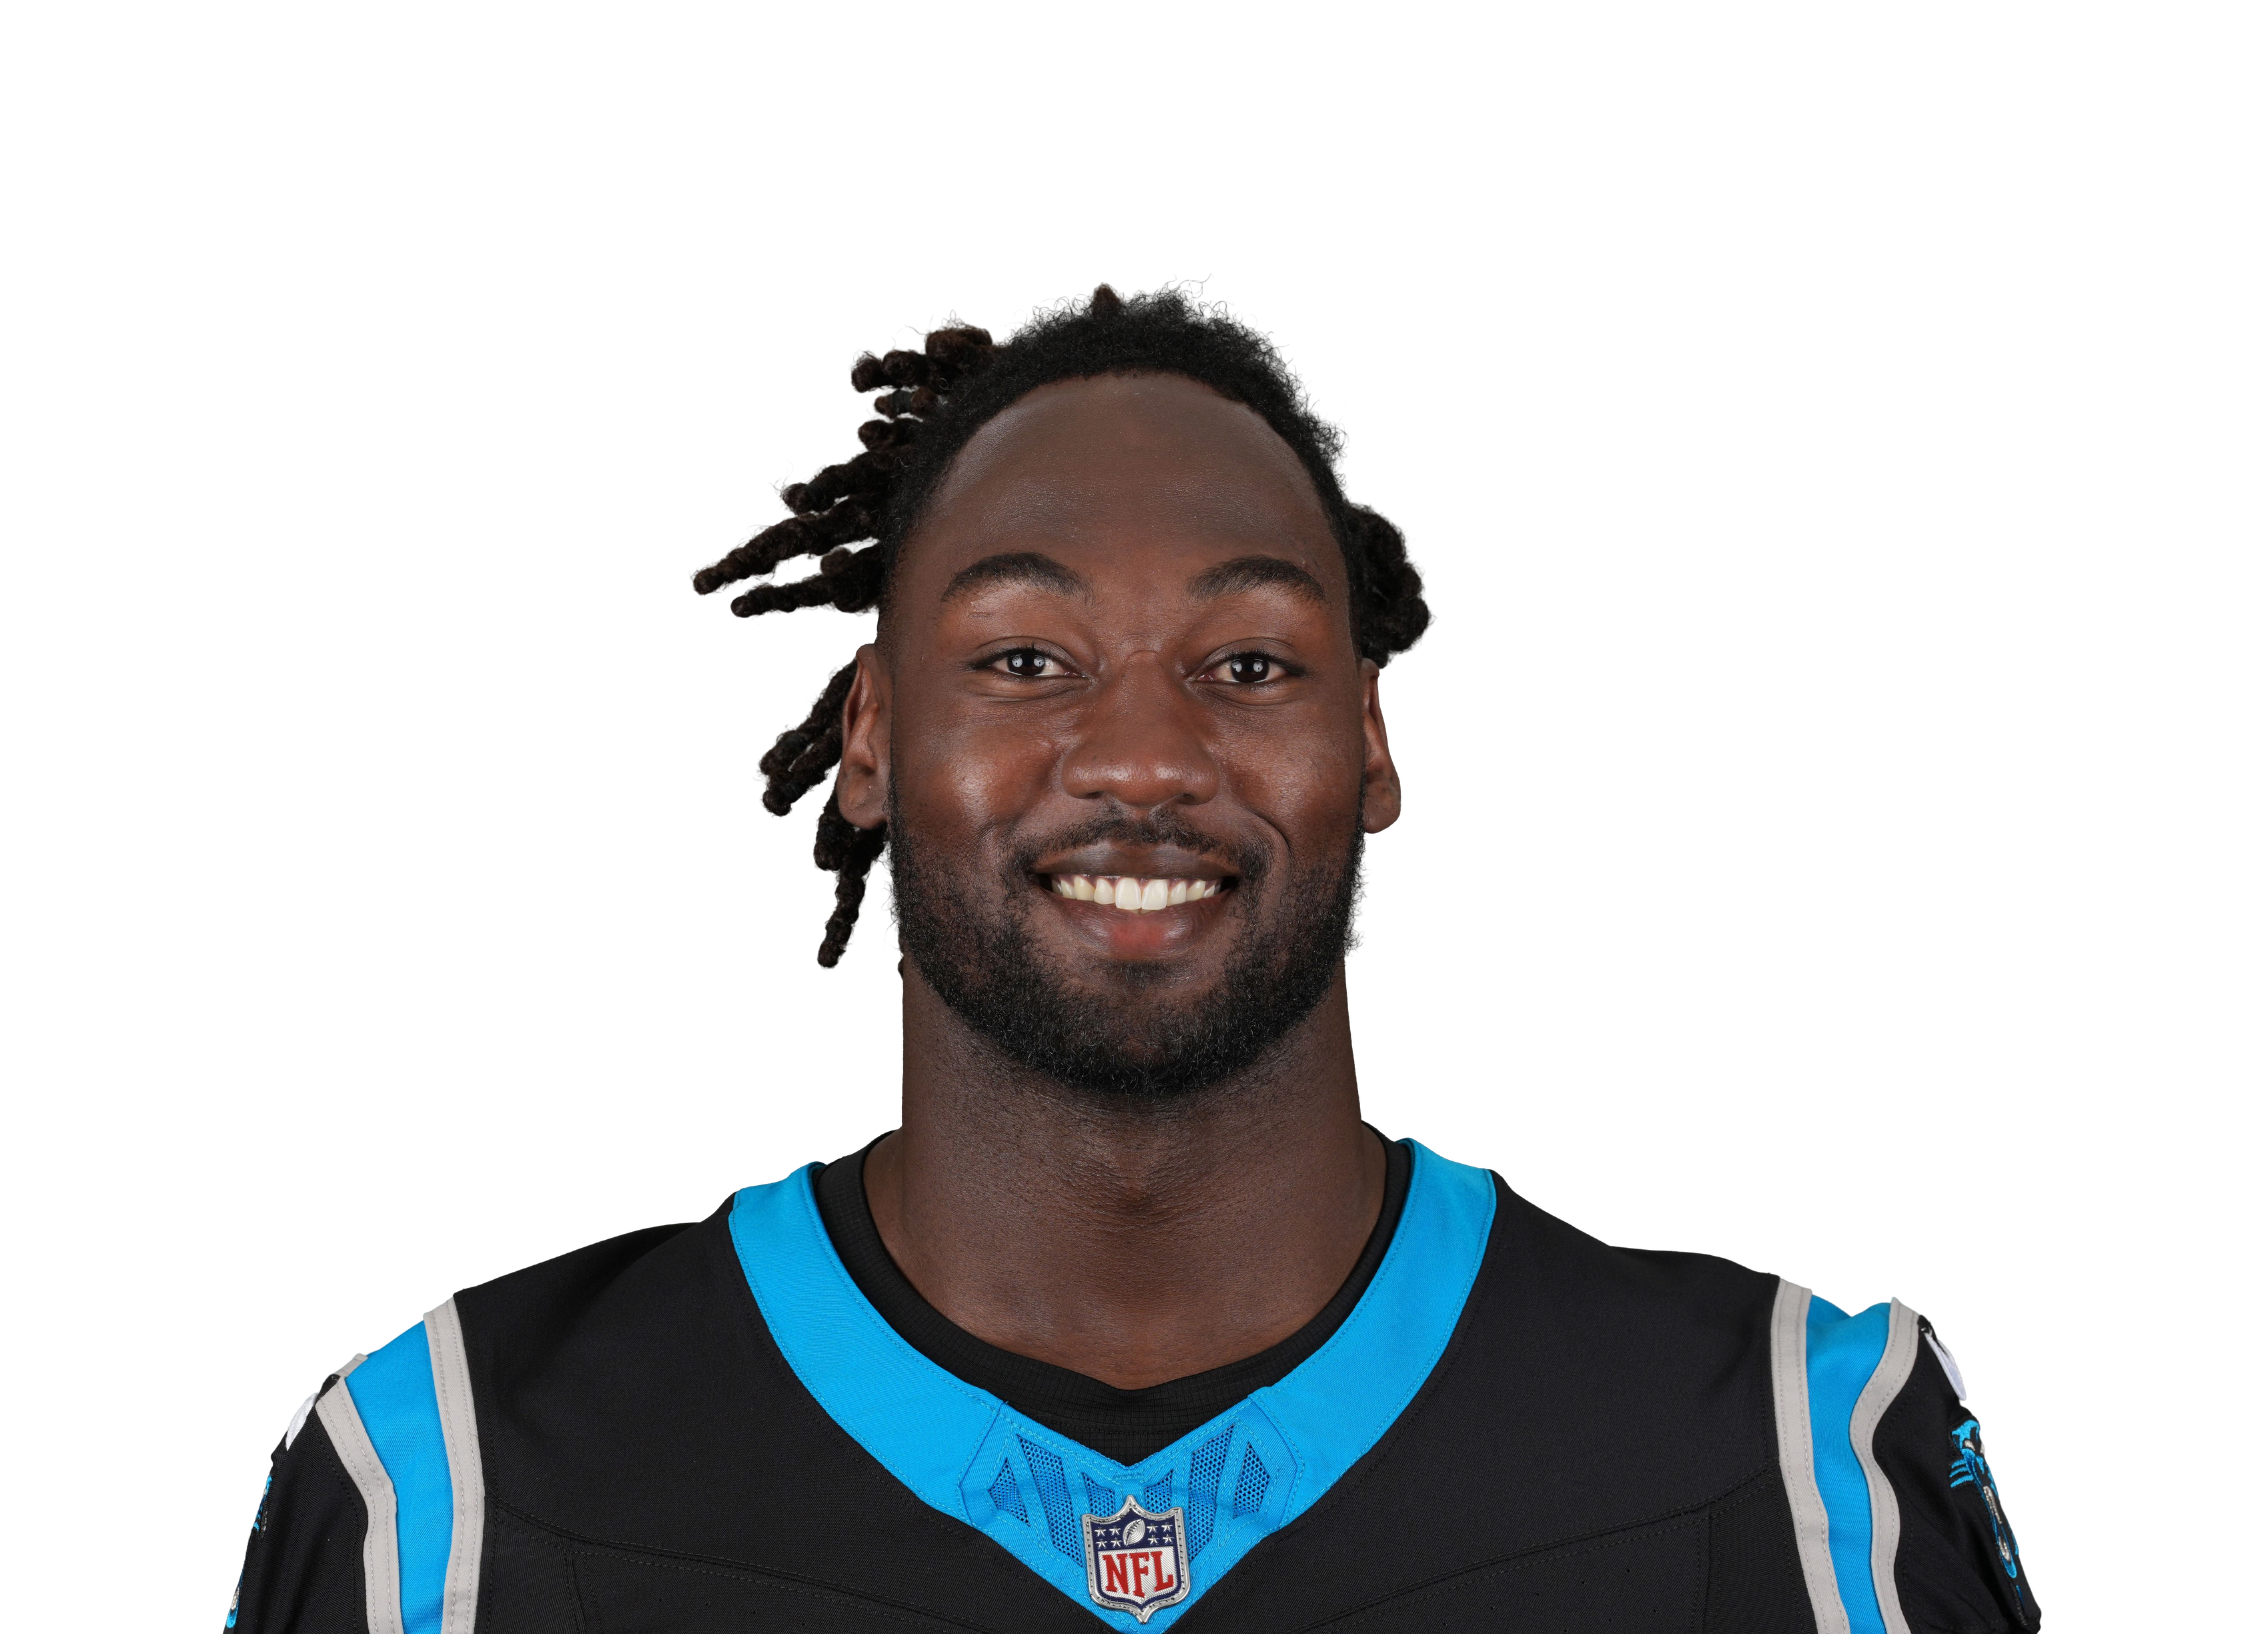
Tackles
38▼ 41 vs '25
45th of 123 LBs
Stops
17▼ 18 vs '25
60th of 123 LBs
Yards per run tackle
3.2▼ 0.8 vs '25
62nd of 123 LBs
Missed tackle rate
2.5%▼ 5.3 vs '25
25th of 123 LBs
Coverage
29 targets
58.6 cmp% · 6.0 y/tgt · 2 int
Ranks compare against the 123 qualifying linebackers on the 2026 leaderboard.
Week-by-week
Tackles by game, dashed line = 2025 per-game average
2026 game log
| Usage | Tackling | Pass rush | Coverage | |||||||||||
|---|---|---|---|---|---|---|---|---|---|---|---|---|---|---|
| Game | ||||||||||||||
| Wk 1 vs CHIL | 74 | 98.7 | 12 | 5 | 0 | 1 | 0.0 | 0 | 3 | 7 | 85.7 | 8.3 | 0 | 0 |
| Wk 2 @ ATLW | 49 | 71.0 | 9 | 5 | 2 | 0 | 1.0 | 1 | 1 | 6 | 50.0 | 6.2 | 2 | 3 |
| Wk 4 vs DETW | 71 | 100.0 | 9 | 4 | 1 | 0 | 0.0 | 1 | 1 | 12 | 50.0 | 5.9 | 0 | 0 |
| Wk 6 @ PHIW | 64 | 100.0 | 4 | 2 | 1 | 0 | 1.0 | 2 | 2 | 4 | 50.0 | 1.8 | 0 | 0 |
| Wk 7 vs TBL | 50 | 79.4 | 4 | 1 | 0 | 0 | 0.0 | 1 | 0 | 0 | – | – | 0 | 0 |
| Season | 308 | 90.1 | 38 | 17 | 4 | 1 | 2.0 | 5 | 7 | 29 | 58.6 | 6.0 | 2 | 3 |
How he compares
2026 linebackers who qualify · dashed lines mark the group average
Contract
signed 2026 with Panthers
$45Mover 3 years
- Avg. per year
- $15M
- Guaranteed
- $25M 56%
- 2026 cap hit
- $6.8M 2.2% of the cap
- Signed
- 2026
- Runs through
- 2028
2026 · now
2027
2028
Year 1 of 3 ·
Career by season
| Overall | Tackling | Pass rush | Coverage | |||||||||||||
|---|---|---|---|---|---|---|---|---|---|---|---|---|---|---|---|---|
| Season | ||||||||||||||||
| 2026 | 5 | 308 | 90.1 | 38 | 17 | 4 | 2.5 | 2.0 | 5 | 7 | 29 | 58.5 | 2 | 3 | 0 | 1 |
| 2025 | 15 | 706 | 73.2 | 79 | 35 | 6 | 7.8 | 1.5 | 10 | 15 | 47 | 57.1 | 5 | 7 | 0 | 1 |
| 2024 | 16 | 883 | 78.8 | 109 | 57 | 7 | 6.6 | 2.0 | 5 | 6 | 53 | 109.6 | 1 | 4 | 1 | 0 |
| 2023 | 15 | 966 | 97.2 | 110 | 68 | 2 | 7.9 | 0.0 | 1 | 2 | 72 | 94.7 | 0 | 7 | 0 | 0 |
| 2022 | 17 | 926 | 79.6 | 108 | 48 | 0 | 11.1 | 0.0 | 2 | 3 | 79 | 101.7 | 3 | 8 | 0 | 0 |
| Career | 68 | 3,789 | 82.7 | 444 | 225 | 19 | 8.0 | 5.5 | 23 | 33 | 280 | 88.6 | 11 | 29 | 1 | 2 |