

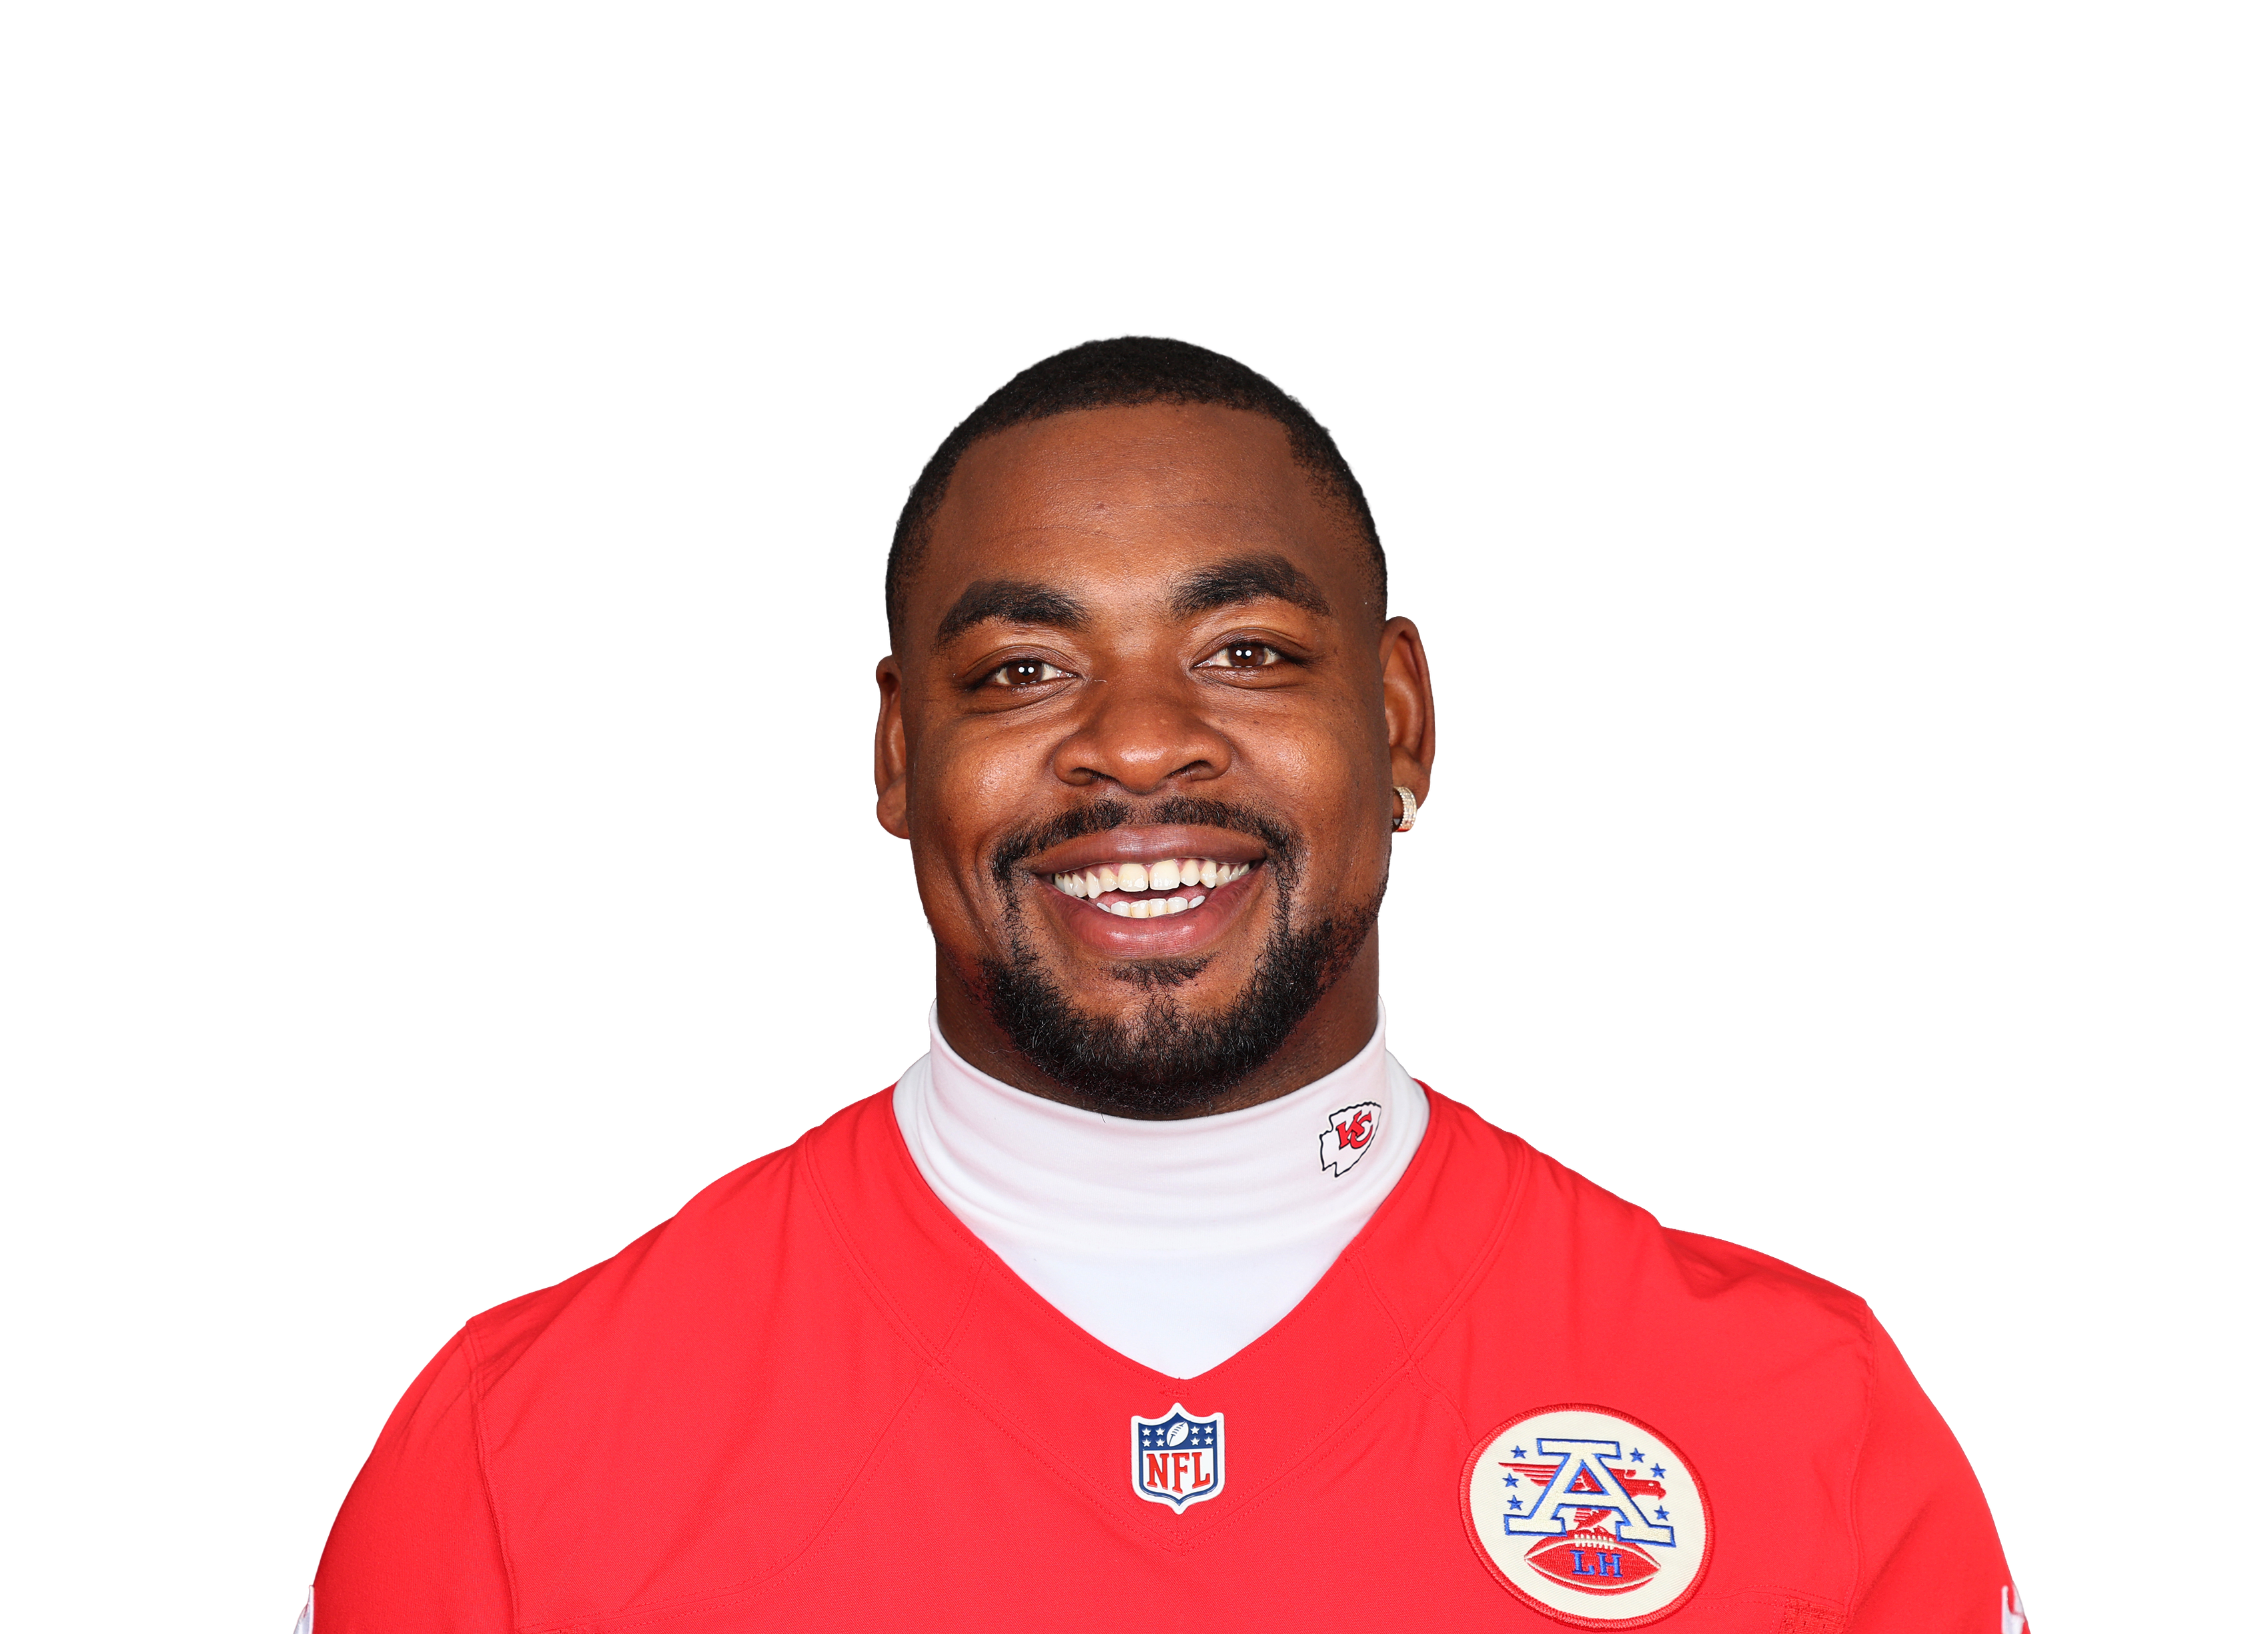
DE · Kansas City Chiefs · #95
Chris Jones
LDT1- College
- Mississippi State
- Height
- 6'6"
- Weight
- 310 lb
- Experience
- 11th season
Sacks
0.5▼ 6.5 vs '25
79th of 118 DL
Pressures
6▼ 25 vs '25
47th of 118 DL
Pressure rate
2.1%▼ 2.0 vs '25
63rd of 118 DL
Run stops
4▼ 13 vs '25
102nd of 118 DL
Tackling
13 tkl
1 tfl · 7 stops · 0 ff
Ranks compare against the 118 qualifying defensive linemen on the 2026 leaderboard.
Week-by-week
Pressures by game, dashed line = 2025 per-game average
2026 game log
| Usage | Tackling | Pass rush | Coverage | |||||||||||
|---|---|---|---|---|---|---|---|---|---|---|---|---|---|---|
| Game | ||||||||||||||
| Wk 1 vs DENW | 26 | 51.0 | 1 | 1 | 0 | 0 | 0.0 | 0 | 1 | 0 | – | – | 0 | 0 |
| Wk 2 vs INDW | 44 | 67.7 | 6 | 2 | 0 | 0 | 0.0 | 1 | 1 | 0 | – | – | 0 | 0 |
| Wk 3 @ MIAW | 53 | 72.6 | 2 | 1 | 0 | 0 | 0.0 | 0 | 0 | 0 | – | – | 0 | 1 |
| Wk 4 @ LVW | 68 | 81.0 | 2 | 1 | 1 | 1 | 0.0 | 1 | 3 | 0 | – | – | 0 | 1 |
| Wk 6 vs LACW | 51 | 75.0 | 2 | 2 | 0 | 0 | 0.5 | 1 | 1 | 1 | 100.0 | 4.0 | 0 | 0 |
| Wk 7 @ SEAL | 45 | 65.2 | 0 | 0 | 0 | 1 | 0.0 | 0 | 0 | 0 | – | – | 0 | 0 |
| Season | 287 | 70.0 | 13 | 7 | 1 | 2 | 0.5 | 3 | 6 | 1 | 100.0 | 4.0 | 0 | 2 |
How he compares
2026 defensive linemen who qualify · dashed lines mark the group average
Contract
signed 2024 with Chiefs
$159Mover 5 years
- Avg. per year
- $31.8M
- Guaranteed
- $60M 38%
- 2026 cap hit
- $44.9M 14.9% of the cap
- Signed
- 2024
- Runs through
- 2028
2024
2025
2026 · now
2027
2028
Year 3 of 5 ·
Career by season
| Overall | Tackling | Pass rush | Coverage | |||||||||||||
|---|---|---|---|---|---|---|---|---|---|---|---|---|---|---|---|---|
| Season | ||||||||||||||||
| 2026 | 6 | 287 | 70.0 | 13 | 7 | 1 | 15.4 | 0.5 | 3 | 6 | 1 | 83.3 | 0 | 2 | 0 | 0 |
| 2025 | 17 | 761 | 73.1 | 27 | 24 | 12 | 4.8 | 7.0 | 25 | 31 | 0 | – | 0 | 2 | 0 | 0 |
| 2024 | 15 | 771 | 82.7 | 36 | 31 | 9 | 5.1 | 5.0 | 20 | 38 | 2 | 56.3 | 0 | 0 | 1 | 0 |
| 2023 | 16 | 741 | 72.6 | 29 | 25 | 13 | 12.0 | 10.5 | 29 | 39 | 1 | 118.8 | 0 | 4 | 0 | 0 |
| 2022 | 17 | 916 | 79.8 | 37 | 39 | 15 | 2.5 | 15.5 | 29 | 46 | 5 | 105.8 | 0 | 4 | 2 | 0 |
| 2021 | 14 | 628 | 68.1 | 26 | 20 | 8 | 12.9 | 9.0 | 17 | 34 | 1 | 91.7 | 0 | 5 | 1 | 0 |
| 2020 | 15 | 693 | 67.4 | 36 | 26 | 3 | 20.0 | 7.5 | 28 | 44 | 0 | – | 0 | 4 | 2 | 0 |
| 2019 | 13 | 646 | 72.7 | 34 | 29 | 8 | 5.3 | 9.0 | 20 | 27 | 1 | 56.3 | 0 | 4 | 1 | 0 |
| 2018 | 16 | 773 | 65.7 | 38 | 34 | 19 | 11.9 | 15.5 | 29 | 49 | 1 | 39.6 | 1 | 5 | 2 | 1 |
| 2017 | 16 | 678 | 61.5 | 29 | 28 | 4 | – | 6.5 | 13 | – | – | – | 1 | 7 | 4 | 0 |
| 2016 | 16 | 573 | 51.3 | 27 | 22 | 5 | – | 2.0 | 10 | – | – | – | 0 | 4 | 0 | 0 |
| Career | 161 | 7,467 | 69.2 | 332 | 285 | 97 | 9.9 | 88.0 | 223 | 314 | 12 | 56.6 | 2 | 41 | 13 | 1 |